|
||
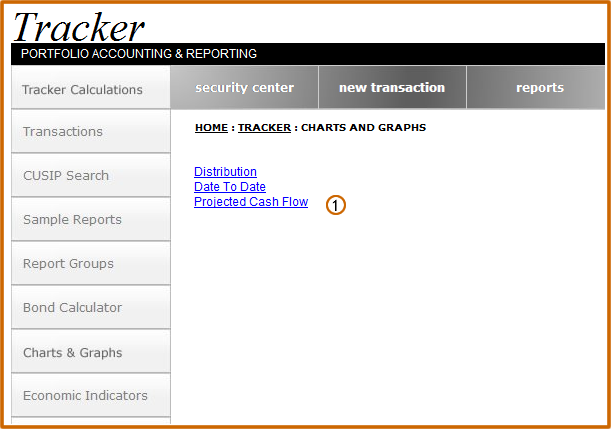
Charts/Graphs:
Projected Cash Flow
| Click the Projected Cash Flow link | |
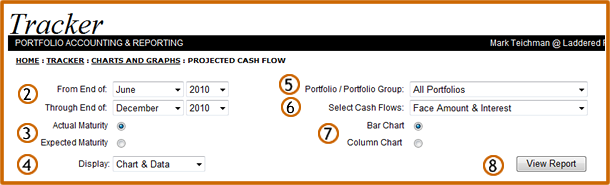
| Using the drop down menu, select the month and year for the Projected Cash Flow report | |
| Select Actual or Expected maturity | |
| Click on the radio button to select the data to be displayed on the report | |
| From the drop down menu, select the specific portfolio or group to be included in the distribution report | |
| From the drop down menu, select the specific cash flows to be included in the Projected Cash Flow report | |
| Click the radio button to select the type of report to display | |
| Click the View Report button | |
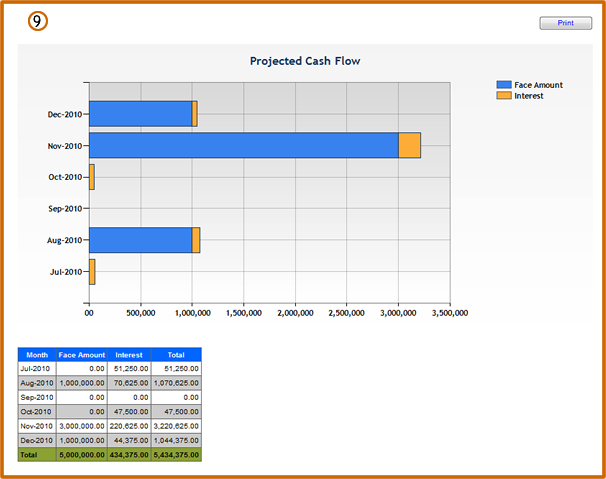
| The Projected Cash Flow Bar Chart report is displayed |