|
||
Charts/Graphs
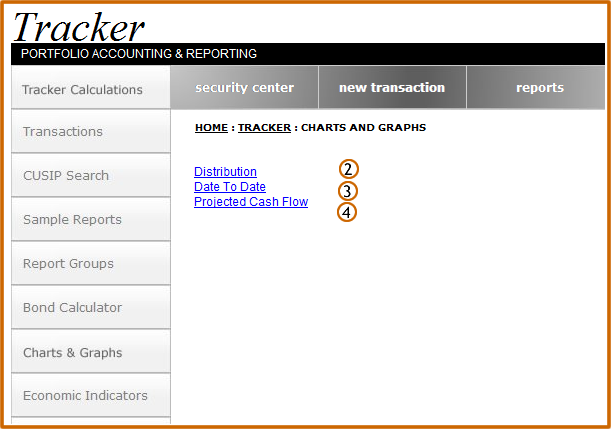
Tracker gives users the ability to create Charts and Graphs exactly the way they want them. There are three types of charts & graphs: Distribution, Date to Date and Projected Cash Flow. To create a custom chart & graph report: |
|
|
Select the Charts & Graphs tab located on the side toolbar of the Tracker homepage | |
| Catagory 1: Distribution | |
| Catagory 2: Distribution | |
| Catagory 3: Distribution |