|
||
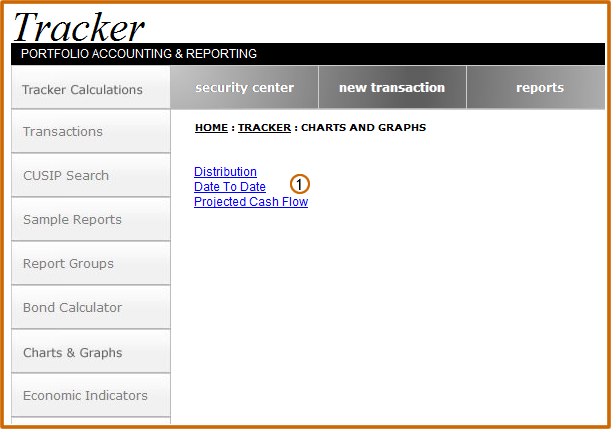
Charts/Graphs:
Date to Date
| Click the Date to Date link | |
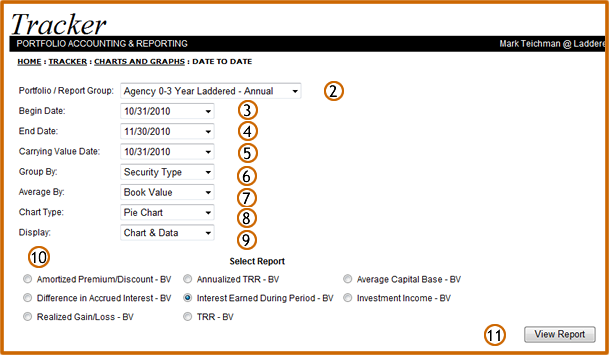
| From the drop down menu, select the specific portfolio or group to be included in the distribution report | |
| Using the drop down menu, select the beginning date for your date to date report. | |
| Using the drop down menu, select the ending date for your date to date report | |
| Using the drop down menu, select the carrying value date for the report. The carrying value date can be on or before the beginning report date. The carrying value date establishes the security value to be used in computing unrealized gains and losses for the report period | |
| Use the Group by drop down menu to select the way in which the information will be separated on the report. For example, if you group by Security Type, the information will separated into categories based on the types of securities in the portfolio. The report will display a subtotal or average, if applicable, for each category as well as grand totals and averages. | |
| Any averages to be displayed on the custom report can be done using one of three available options: Face amount/shares, cost value or market value. Use the drop down menu to select the desired option to be used in computing these averages | |
| Use the Chart Type drop down menu to select the type of report to display | |
| Use the Display drop down menu to select the data of report to display | |
| Click on the radio button to select the data to be displayed on the report | |
| Click the View Report button | |
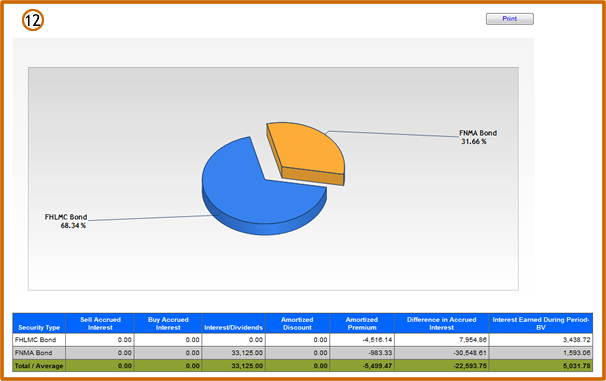
| The Date to Date Pie Chart report is displayed |