|
||
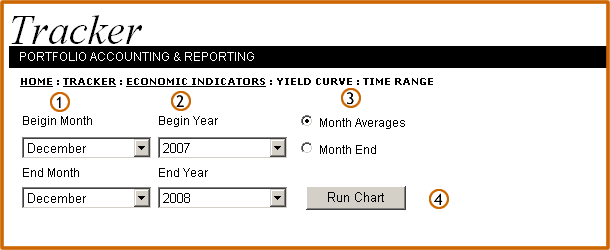
Economic Indicators:
Yield Curve-Time Range
| Use the drop down menu to select the begin and end month for the report | |
| Use the drop down menu to select the begin and end year for the report | |
| Select if you want a monthly average or a month end value for your report | |
| Click the Run Chart button to process the report | |
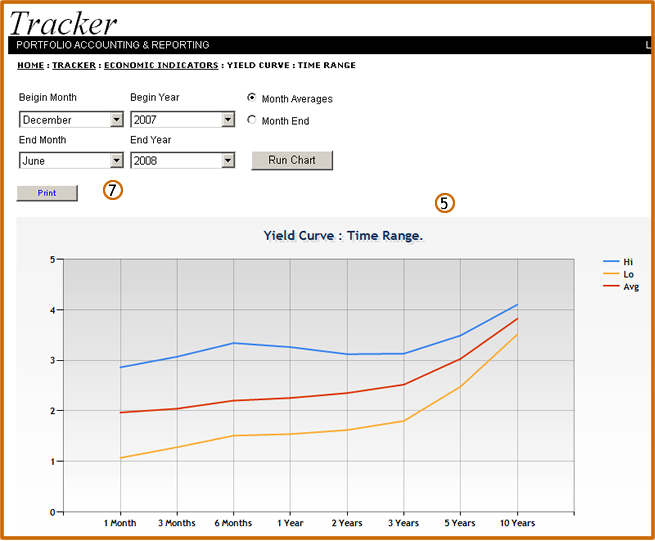
| The report is displayed as a graph | |
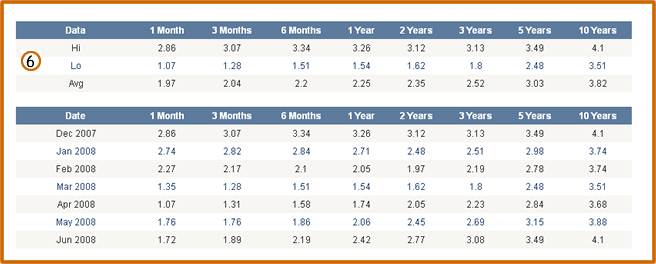
| The report is also displayed as a chart | |
| Click the Print button to process a printable version of the report |